Anomaly Detection in the Service Mesh
This post seeks to research and better understand the feasibility of using machine learning models to analyze traffic between microservices in order to perform anomaly detection in the service mesh. The goal of this research is to utilize these models to perform real time policy enforcement decisions based on changes in requests between services.
Introduction
Microservice architectures enable the continuous delivery and deployment of complex distributed systems. With this architecture choice comes the challenge of connecting, managing, and securing communications between the various microservices. Recent application level denial of service attacks which target backend services have demonstrated a rising attack vector that is capable of bringing down enterprise level systems with minimal cost and effort. By targeting expensive services using readily available cloud computing services, a single user is capable of backing up an entire system and causing widespread outages.
Scope of the Study
The aim of this initial study is to perform the necessary exploratory research to figure out whether it will be possible to make policy enforcement decisions in the service mesh using a machine learning model. If it’s possible to create a model that demonstrates a high level of accuracy using a small subset of features, that model can then be used to apply organizational policy to the interaction between services and ensure access policies are enforced. These policy changes would be made by configuring the mesh and not by changing application code.
Technical Background
Modern service meshes are logically split into a data plane and a control plane. The data plane is typically composed of a set of intelligent proxies deployed as sidecars that mediate and control all network communication between microservices. These sidecar proxies are typically deployed alongside each microservice as a secondary microservice in order to intercept and manage all network communication between the microservices. The control plane is responsible for managing and configuring proxies to route traffic, as well as enforcing policies at runtime. It typically provides a generic intermediation layer between application code and infrastructure backends. Modern systems seek to move policy decisions out of the application layer and into configuration files instead, which allows for quick changes without the need to touch application code.

Figure 1. Modern Microservice Based Architecture. This figure demonstrates the layout of a modern microservice based architecture in which each microservice has a second microservice deployed along with it, which is responsible for managing network traffic and communicating with the control plane.
Limitations
The most significant limitation to the research performed was the lack of production data available for use. A small, stand-alone microservice based application was deployed and mock traffic simulating what is seen in production systems was generated for data collection and testing.
Arrangement
This post is broken down into three main section. This first introductory section sought to give the appropriate background information necessary for the post. The next section is on the research itself and how I went about doing it. Finally, the last section brings together what was learned throughout the research and how it can be applied in the future.
Research
For the research portion of this post, enough usable network traffic data needed to be gathered to form a training set and a test set for the eventual machine learning model. Initially, I was hoping to gather real production traffic, but due to data availability restrictions, I ended up deciding that it would be better to deploy my own application into the cloud and generate mock traffic. Following this, I would then be able to clean and sanitize the network traffic I saw and feed that into the end model.
Application Overview
A microservice based application was deployed using Google Cloud Platform, Google’s cloud computing platform-as-a-service (PaaS). This application had a single point of entry that would then make calls to two other services. One of those services would be called each time, while one of three potential services would be called in a round robin manner. Two of the three potential services would then make a call to another service. See Figure 2 for more details on the application.

Figure 2. Overview of the Deployed Microservice Based Application. This figure shows the microservice based application that was deployed into the cloud environment. External traffic would arrive at the entry service, which would then communicate with one guaranteed service and one of three potential services in a round robin manner. Two of those three potential services would then make calls to another service.
Additionally, in order to better represent typical network traffic, a login page was deployed so that it was possible to look at POST requests in addition to GET requests.
Containers
Each one of these microservices was “containerized” using Docker. Containers are well-suited for microservice based applications because they provide an executable piece of software that is stand-alone and lightweight. These containers are capable of running on a single machine that shares the operating system’s kernel. Additionally, they are isolated, which allows for an additional degree of security in the event that one is compromised.

Figure 3. Container Infrastructure. Containers are lightweight, executable software packages that included everything needed to run them (system libraries, code, etc.). They share the host operating system’s kernel, so many containers are capable of running on a single machine.
Container Orchestration
Kubernetes was used in order to manage the deployment of the various containerized services. Kubernetes is useful for automating the scaling and deployment of containerized applications. In this case, it was used to deploy all of the application’s containerized microservices at once.
Microservice Management and Security
The next challenge was to figure out how to manage the communication of microservices including the ability to enforce future policy decisions. Istio was used for this endeavor, as it provides a platform to connect, manage, and secure microservices. This includes deploying a sidecar proxy microservice alongside each microservice in the application and using a control plane API that is able to make policy enforcement decisions. Additionally, policy changes are made via configuration files (such as YAML), which allows for configuration changes on the fly and eliminates the need for policy logic in service code.
Within Istio’s control plane API is a service called Mixer, which is responsible for performing precondition checking and telemetry reporting. From this telemetry reporting and several monitoring tools that I setup, I was able to find a number of potential machine learning features. As a result, I ended up logging all this data from Mixer, which ended up forming the basis of my machine learning dataset.
Generating Traffic
In order to generate mock traffic to my application, several endpoints that were responsible for making requests to the application were set up. These endpoints consisted of various physical computers that I had access to and instances that were set up in Google Cloud Platform. To simulate the randomness of normal requests, random requests were made to the application at intervals that were unique to each of the boxes. You can see an example of a Bash script that was used below.
#!/bin/bash
for i in {1..10000}
do
    curl -o /dev/null -s -w "%{http_code}\n" http://35.224.206.29/productpage
    sleep $((RANDOM % 120))
done
These scripts ran for several weeks in order to ensure that there would be enough traffic to feed into the machine learning model. Periodically, denial-of-service (DoS) attacks were performed on the web application in order to make the data more interesting.
Data Exploration
At this point, there was a lot of usable data to start diving into. See Table 1 for a list of features and sample data that were logged in the initial dataset.
| Number | Feature | Sample Data |
|---|---|---|
| 1 | Destination IP | AAAAAAAAAAAAAP//CjACBQ== |
| 2 | Latency | 23.5ms |
| 3 | Level | info |
| 4 | Method | GET |
| 5 | Protocol | http |
| 6 | Request Size | 0 |
| 7 | Response Code | 200 |
| 8 | Response Size | 375 |
| 9 | Severity | INFO |
| 10 | Source IP | CjACCQ== |
| 11 | Timestamp | 2018-03-03T04:00:28.868748Z |
| 12 | URL | /details/0 |
Table 1. Initial Features of Interest and Sample Log Data. Listed are a number of features that had the potential for security vulnerabilities. As such, I logged all of this data from the application for further analysis and processing.
Upon diving into the data, it could be seen that level, protocol, and severity only had a singular value recorded, so that data was discarded. Additionally, I noticed that several malicious web crawlers in search of web application vulnerabilities had identified my cloud application. This ended up contributing a lot of useful data to the URL feature, as it was possible to see many attempts at executing common web vulnerabilities and targeting potential login pages. A small subsection of this data is displayed below.
/phpMyAdmin/scripts/setup.php
/phpMyAdmin/scripts/db_setup.init.php
/w00tw00t.at.blackhats.romanian.anti-sec:)
/.idea/WebServers.xml
/wp-login.php
/index.php?page=/etc/passwd
/CFIDE/administrator/
I observed some surprising results when analyzing the response code data. There were the expected 200s from valid data and 503s from the server being unavailable. However, there were also a number of 400s and 404s from the URL attempts we previously saw that were invalid requests or were made to pages that did not exist, 426s which refused to perform requests using the current protocol (upgrade required), and 302s from URL redirects.
As expected with the HTTP request methods, we saw GET requests the most and some POST requests for the login functionality. I also saw some HEAD requests which asked for a response identical to that of a GET request minus the response body and OPTIONS requests for describing communication options for the target research. The PROPFIND requests were particularly interesting, as these requests are an artifact from Microsoft Exchange Server 2003, which is no longer actively maintained. There are a number of known vulnerabilities that can be exploited using PROPFIND requests and since the request is no longer actively maintained, there is no patch available.
There wasn’t much variation in the request sizes seen in the dataset, but there was some variation in the response size. For more information on this data, see Table 2.
| Evaluation | request_size | response_size |
|---|---|---|
| Count | 174103 | 174103 |
| Mean | 0.002470 | 2094.296663 |
| Standard Deviation | 0.542487 | 2493.042869 |
| Max | 208 | 5849 |
Table 2. Request Size vs. Response Size Statistics. There wasn’t much difference in the request size data, but we did see significantly more variation in response size data. All requests and responses were recorded as number of bytes in size.
I believe that response size would make a useful addition to a model making policy enforcement decisions because recent microservice based application distributed denial-of-service (DDoS) attacks have shown that manipulating request headers in order to target expensive backend services (and thus costlier response sizes) has been proven to be able to cause widespread outages in production systems. See Figure 4 below for a closer look at request size and response size differences seen in the dataset.
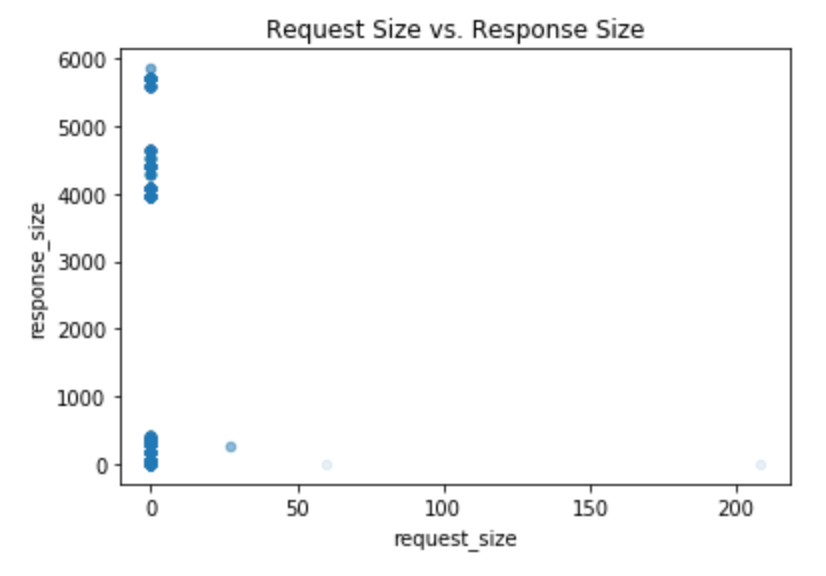 Figure 4. Request Size vs. Response Size. A demonstration of request sizes that were seen in the data and their corresponding response sizes. All requests and responses were recorded as number of bytes in size.
There wasn’t much variation in the source IP, but I believe that the source IP feature would prove extremely valuable in a production system. This is because once an attacker makes it into a system, they attempt to move laterally through that system. If a service typically only sees requests coming from a few IPs and then suddenly starts seeing random access attempts from another IP, this is potentially a sign of compromise.
Data Cleansing
As previously mentioned, level, protocol, and severity were discarded, as there was no variation in these potential features. Additionally, I wanted to narrow down my potential feature selection to a handful of features with the highest potential to predict anomalies based on results seen in the sample dataset. As such, the latency, response code, and time stamp features were eliminated as well. This left me with destination IP, request method, request size, response size, source IP, and URL to work with. I believe that some of these eliminated features may prove useful in a production environment, but for this initial research, I wanted to narrow in on a smaller subset of features.
All other features other than request size and response size were essentially text labels, so I began by encoding these input values as enumerated types and categorical variables. However, machine learning algorithms will assume that two nearby numerical values are more similar to each other, so one-hot encoding was performed in order to create one binary attribute per category. A pipeline was then built for preprocessing the various numerical and categorical attributes from the dataset and for clearing out any rows that had missing data. At this point, the data had been cleansed and I was ready to move onto building a machine learning model to a aid in anomaly detection.
Machine Learning
K-means clustering was used in order to cluster this data in a way that anomalies can easily be identified and picked out. This algorithm is a type of unsupervised learning, which is well suited for anomaly detection. Unsupervised learning algorithms explore data which has no target attributes with the goal of finding intrinsic structure in the data. The technique of clustering is used for finding similar groups in data (clusters).
At this point, there were 87 separate features in the dataset due to the one-hot encoding of categorical data. Due to the complexity of visualizing any more than 2 or 3 features in space (which correspond to 2D and 3D space respectively), I decided to perform principal component analysis (PCA) on the data in order to put emphasis on variation and attempt to bring out strong patterns. Principal component analysis is a dimensionality reduction technique that linearly maps a dataset to a lower dimensional space with the goal of maximizing variance in the data. A covariance or correlation matrix of the data is built and then the eigenvectors are computed. The eigenvectors for the largest eigenvalues (the principal components) can be used to repicture variance in the original data. For ease of visualization, I chose to reduce my dataset down to two components.
The data was then separated into a training set and a test set. 80% of the dataset was reserved for training the model and 20% of the dataset was reserved for testing the model. A k-means model was then constructed using two clusters for binary classification of the traffic as either an anomaly or not. The results of running the model on the test data can be seen below in Figure 5.
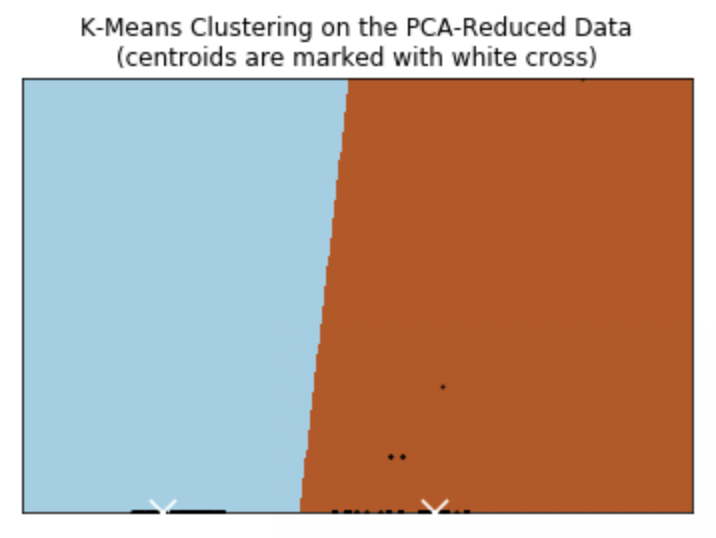 Figure 5. K-Means Clustering on the PCA-Reduced Data. The left (blue) side of the decision boundary represents test data that was not predicted as an anomaly, while the right (brown) side represents test that was predicted to be an anomaly. The centroids (centers of the clusters) are marked with a white cross.
As you can see, the decision boundary provided a stark contrast between data points that were considered an anomaly or not. Having gone back and checked several of these points, I can say that the model accurately predicted the correct classification of the data.
Conclusion
As we continue to see a rise in microservice vulnerabilities as an attack vector, it is imperative that security professionals become proactive about defending against these attacks. Using minimal cost and effort, a single user has the ability to cause widespread outages at the enterprise level. In this initial research, I was able to see very clear results that demonstrated the ease with which anomalies in service mesh traffic can be picked up. I can now confirm that building machine learning models to analyze service mesh traffic and apply appropriate policy enforcement decisions is not only possible, but is something that I’d highly recommend integrating into the architecture strategy of every microservice based application.
References
- Behrens, Scott, and Jeremy Heffner. “Starting The Avalanche: Application DoS In Microservice Architectures.” 2017.
- Burns, Brendan, and David Oppenheimer. “Design Patterns for Container-based Distributed Systems.” HotCloud. 2016.
- “Microsoft Internet Information Services PROPFIND Request Buffer Overflow Vulnerability.” Tools.Cisco.Com, 2017, https://tools.cisco.com/security/center/viewAlert.x?alertId=53206.
- “PROPFIND Method”. Msdn.Microsoft.Com, 2004, https://msdn.microsoft.com/en-us/library/aa142960(v=exchg.65).aspx.
- Sun, Y., et al. “Security-as-a-Service for Microservices-Based Cloud Applications.” 2015 IEEE 7th International Conference on Cloud Computing Technology and Science (CloudCom), 2015, pp. 50–57. IEEE Xplore, doi:10.1109/CloudCom.2015.93.